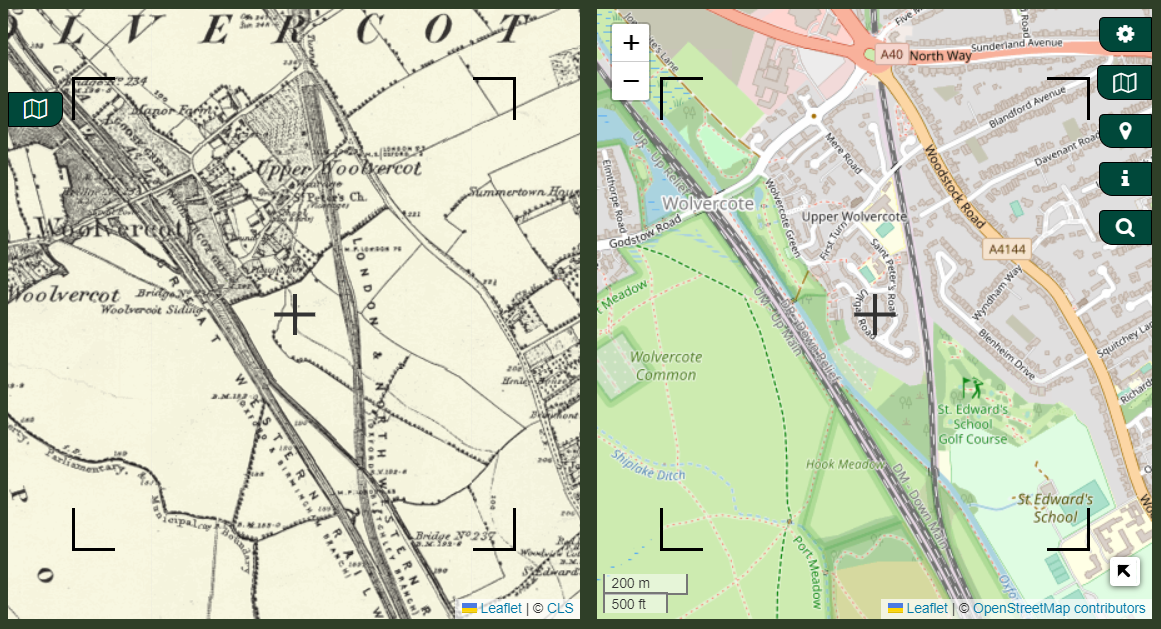
How to use the mapping platform
The sidebar
Use the sidebar at the right of the screen to change your screen layout and select / view map layers or feature layers

Search box
Click / tap the magnifier button to open the Search box which allows you to search for place-names, or any other geographic names in these categories:
Towns, villages, suburbs, street names, woodlands, forests, parks, inland water features, schools, colleges.
This search tool also offers postcode searching. The tool is based on the OS Names API – for more information, see: https://osdatahub.os.uk/docs/names/overview
Type a geographic name into the search box.
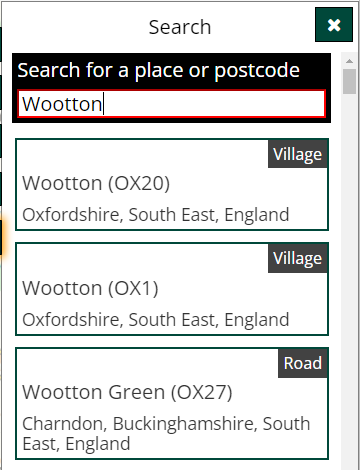
Click / tap on a single search result to display the map position for that selected geographic name.

Viewer controls (zoom)
You can now zoom into your location and select specific map layers for viewing.
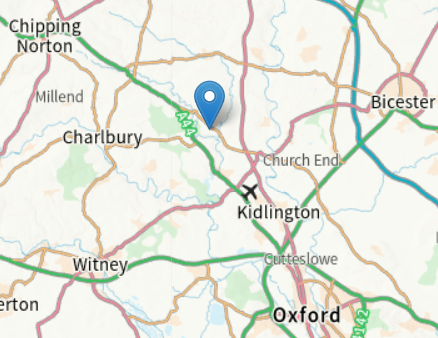
To zoom in or out of your map image, stretch / pinch the image on a tablet or smartphone; on a desktop or laptop use the mouse scroll wheel to zoom, or tap the + / - icons at the top left of the screen

To zoom in or out of your map image, stretch / pinch the image on a tablet or smartphone; on a desktop or laptop use the mouse scroll wheel to zoom, or tap the + / - icons at the top left of the screen
Layout panel
Click / tap the Layout button to open the Layout panel and select your desired screen layout

At any stage, if you want to return to the start, click / tap the Reset map button, inside the Layout panel
To browse the full range of map and feature layers, and to find out more information about each one, click on the Browse all maps button, inside the Layout panel
You can choose from:
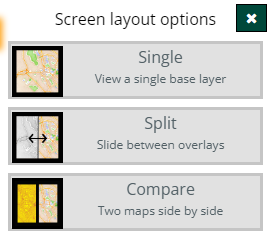
- Single – to view a single map layer [initial examples below use the basic Single screen]
- Split – to view two map layers side by side, with a slider to move between the two [see section below for guidance on the Split screen]
- Compare – to view two map layers which move synchronously, and are displayed side by side in fixed windows
Map layers panel
Then, click / tap the Maps button, to open the Map layers panel and select the map layers you want to display on screen

In the top section of the Map layers panel, click / tap on the relevant icon to select the modern map layer you want to display as your background:
- Open Street Map
- Ordnance Survey
- Aerial photos
You can return to this panel and select a different modern base layer at any stage
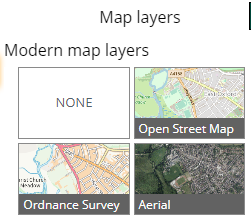
In the bottom section of the Map layers panel, click / tap on the relevant header to select the historic map layer you want to display in the foreground – map layers are arranged in these groups:
- Pre-war 6-inch scale
- Pre-war 25-inch scale
- Post-war 1:10,000
- Post-war 1:2,500
- Post-war 1:1,250
You can return to this panel and select a different historic map layer (or combination of layers) at any stage
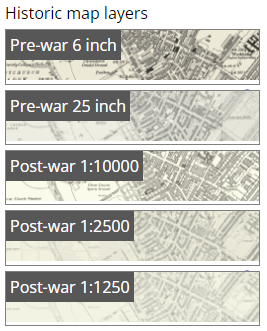
When you click / tap the header for a specific map layer group, it will expand to display all the available editions
For example, the Pre-war 6-inch group offers 4 editions to choose from, which are arranged in order of survey / publication date
Note that both Pre-war 6-inch and Pre-war 25-inch groups offer layers from two different suppliers:
- CLS layers are colour images, but have incomplete coverage, particularly for the 1st edition. Note that the 4th edition was not a full county survey anyway.
- Landmark layers are black/white images, but have full county coverage. They are available for the 1st and 2nd editions only.
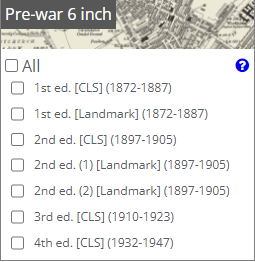
Click / tap the question mark icon to see an overview of the geographical coverage of any map layer group
For example, click tap the question mark alongside the Pre-war 6-inch map layer group
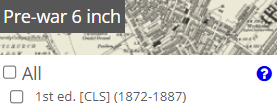
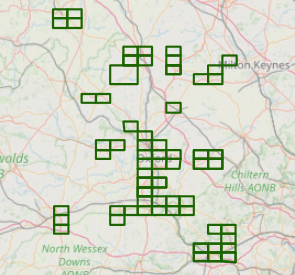
The linked Pre-war 6-inch overview page summarises and all the available map layer editions and dates and displays a coverage map for each one – for example, here is the 4th edition OS County Series (1932-1947) coverage map
Tick the All layers checkbox to switch on all the map layer editions in that group
At any time you can switch individual layers on or off, or use the slider controls to fade them in or out, making it easier to review and understand changes and differences between map editions.
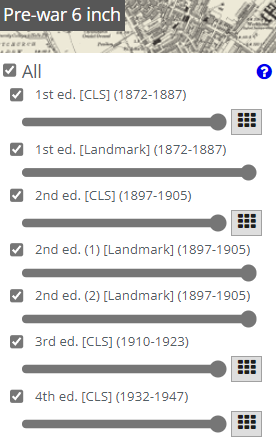
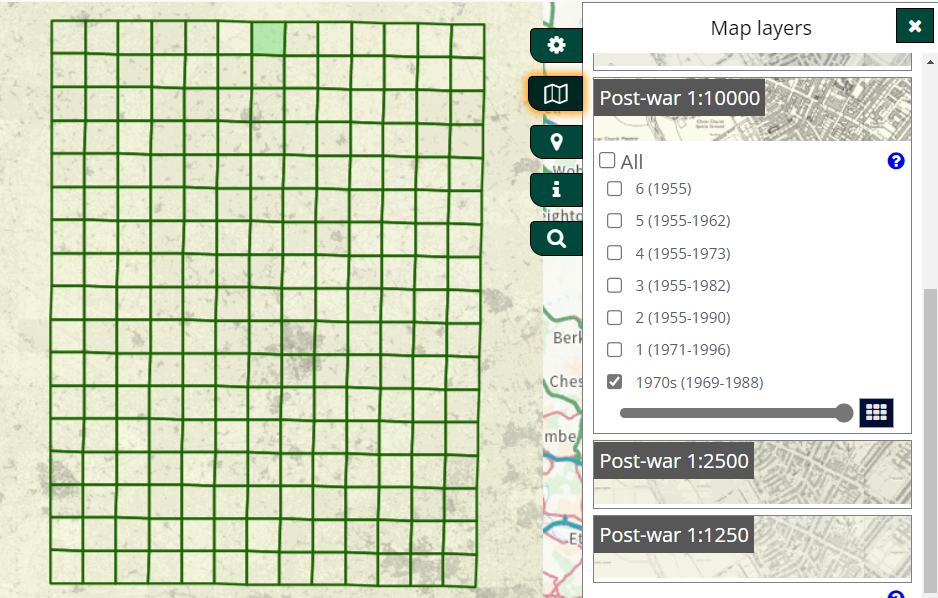
To view the coverage of your selected map layer in detail, click / tap the grid button beside the layer edition name (the layer has to be ticked for the grid button to be visible)

With the grid turned on, all available map sheets for the selected edition will be outlined on screen, indicating its coverage locally and countywide. You may need to zoom out to get a fuller impression of the coverage of your target area.
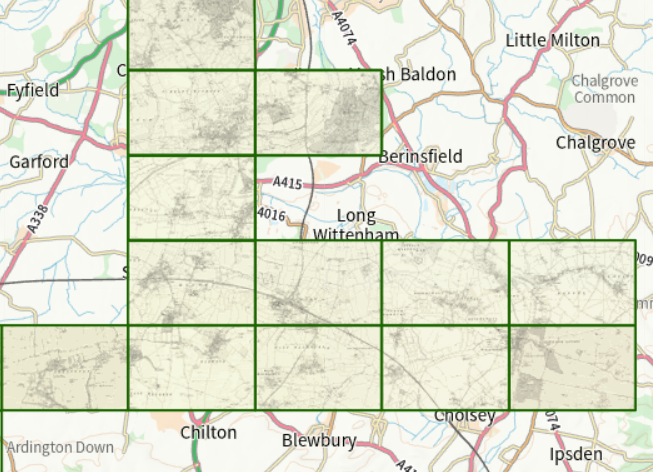
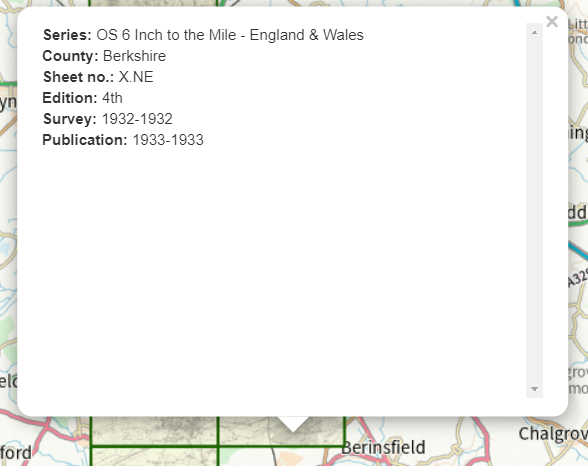
Click / tap an individual map sheet to display a pop-up with metadata about the original map sheet, including its name / number, survey, revision, and publication dates.
Understanding post-war map layer editions
The many different layer editions for the post-war maps appear complex at first, with overlapping dates ranges, especially Post-war 1:10,000
You may need to experiment with different layers turned on, to find the ideal coverage for your target area
The post-war map layers are created and supplied in this format by CLS, to avoid overlapping map image tiles for any given location, and reflect the huge variance across the county in the start, revision and completion dates of the post-war 1:10,000 survey
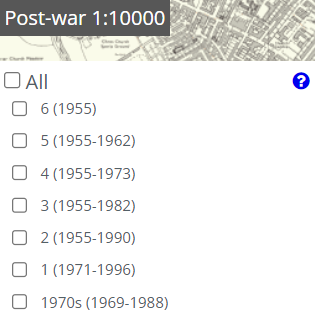
The 1:10,000 1970s layer is a generalised composite layer which can make a useful starting point if you just want to see any post-war map at this scale, but you should check the metadata for an individual map sheet, to be certain of its survey, revision or publication date.
1:2,500 and 1:1,250 post-war layers are simpler, and have a clearer chronological sequence of editions, with A being the first edition for any particular grid square, and B, C, or D editions being later revisions of the same square.
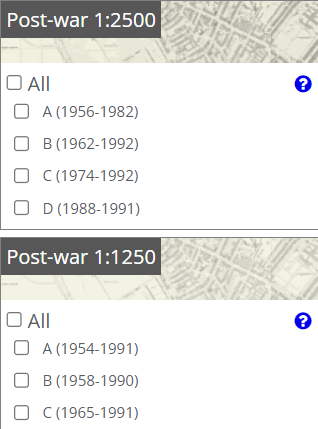
The number of editions, and the ‘lateness’ of completion dates of particular grid squares will vary across the county, according to how urban the location is, and to the amount of change on the ground
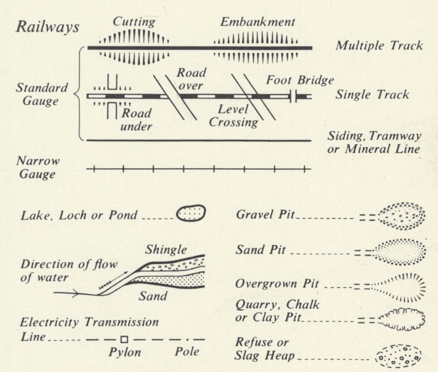
Legend - map signs, symbols and abbreviations
Keys to symbols and text used on pre- and post-war Ordnance Survey maps are available on the overview page for each map layer
Feature layers
Click / tap the feature button to open the Features layer panel

Tick the checkbox to switch on any layer you want to display
Click / tap the question mark icon to find out more information about each feature layer
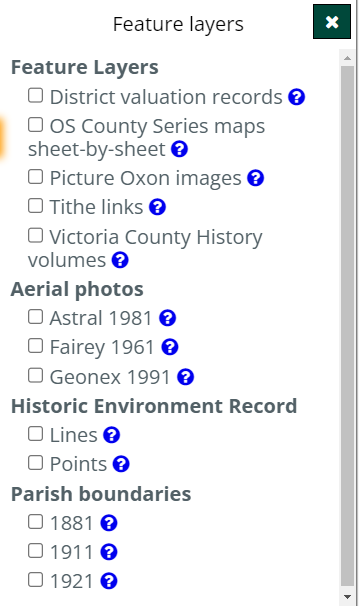
The broad groups of feature layers are:
- (Other) feature layers
- Aerial photos
- Historic Environment Record
- Parish boundaries
There are two types of layers:
- Boundary data, with clickable parcels linking to external resources (e.g. District Valuation, County Series maps, Tithe, Victoria County History)
- Spot or Line data, linking to an internal digital resource within Heritage Search (Picture Oxon, Aerial photos, Historic Environment Record)
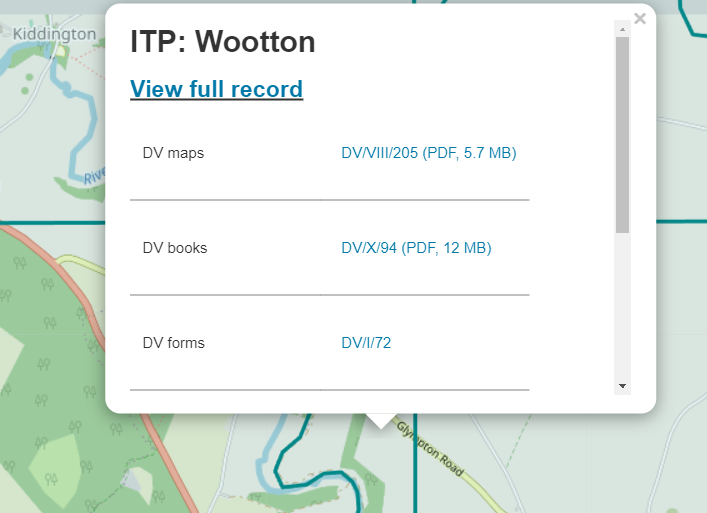
For feature layers of boundary data, click / tap on your desired location on the map, to link to the external resource relating to the parcel of land defined by that boundary
For example, the selected parcel here links to the District Valuation survey records available for that location
Click on the linked PDF resources to view the content (opens in new tab or window)
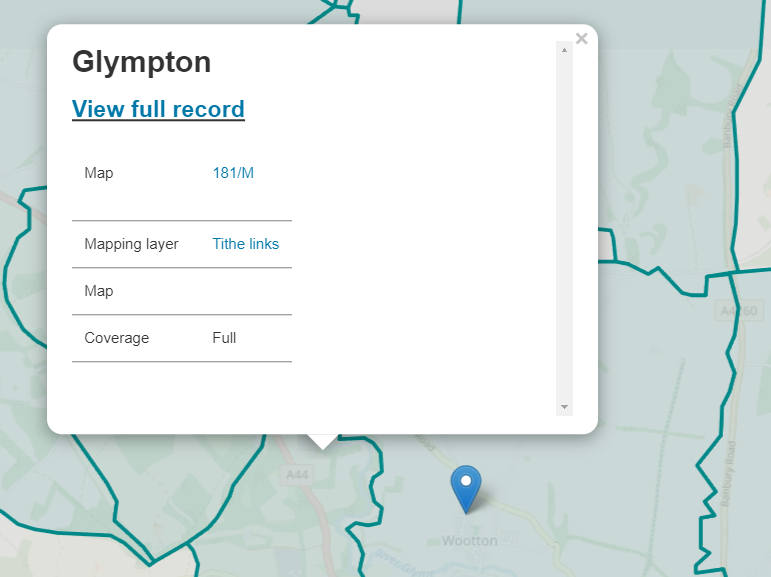
For any given point clicked on the map, if data is available for that area, the Tithe maps boundary data displays in a similar way, providing links to related resources (opens in new tab)
For feature layers of spot data, you may need to zoom the map in or out to see the linked spots
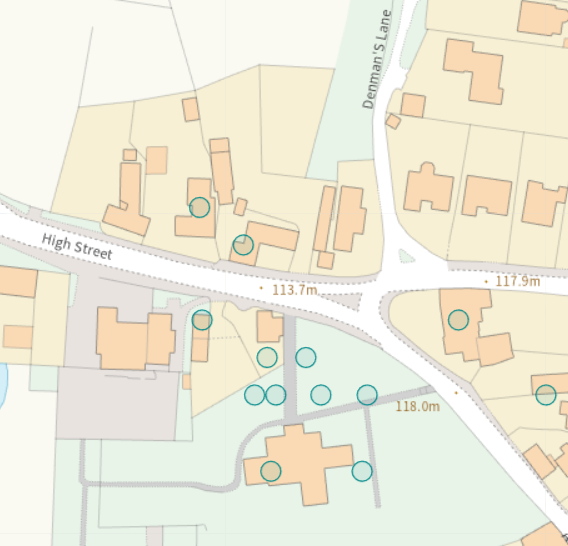
For example, the Picture Oxon image spots often require zooming in, where they cluster around buildings in village centre
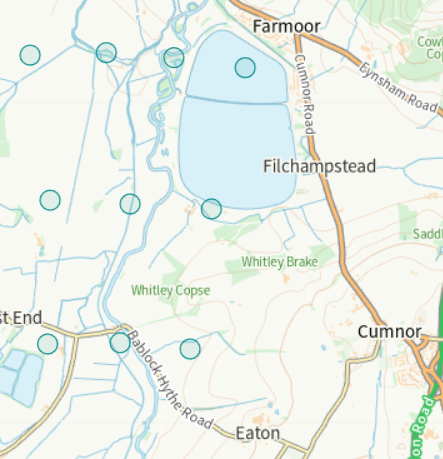
Conversely, the Aerial photos spots often require zooming out of the map to see the nearest spot, as these images cover a larger area
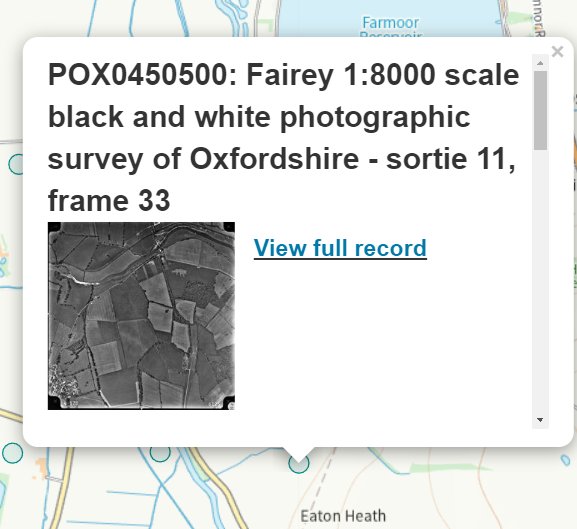
Click / tap on a specific spot to link to the internal resource (in Heritage Search) relating to that spot location on the map
For example, the spot here is a 1961 aerial photo, and a thumbnail image and summary is displayed in the pop-up
Click / tap the ‘View full record’ link to display the full description and zoomable image in a new tab
For feature layers of line data (Historic Environment Record only), firstly you may need to zoom the map out to see where the linked lines are, but then zoom in close enough to a specific line, so that your cursor or finger can click / tap it
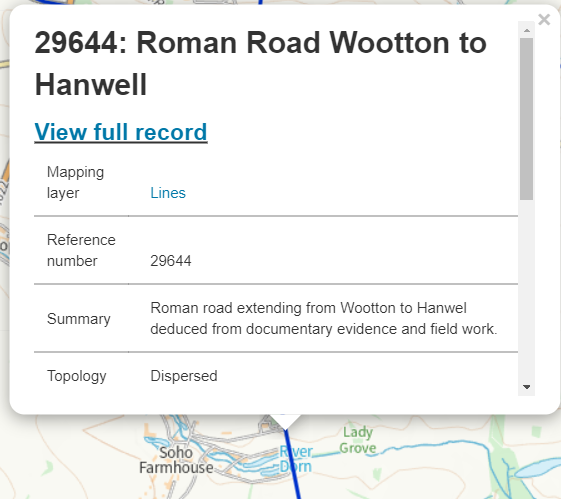
For any linked HER spot or line, a summary record of the data is displayed in the pop-up
Click / tap the ‘View full record’ link to display the full description in Heritage Search
Screen layout - split
Click tap the Split button in the Map layers panel to open the split-screen view

Select your first map layer for the right side of the split, or omit selecting an historic map layer if you just want to compare against the modern base map
Having selected the split screen view, an extra Map button is now visible on the left side of the split
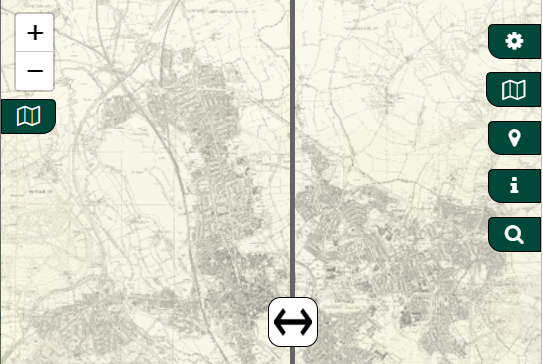
Click / tap the left Map button to open the extra Map layers panel
From the left Map layers panel select the map layer you wish to view in the left side of the split
You can now view the two map layers side by side, and use the slider to move between the two
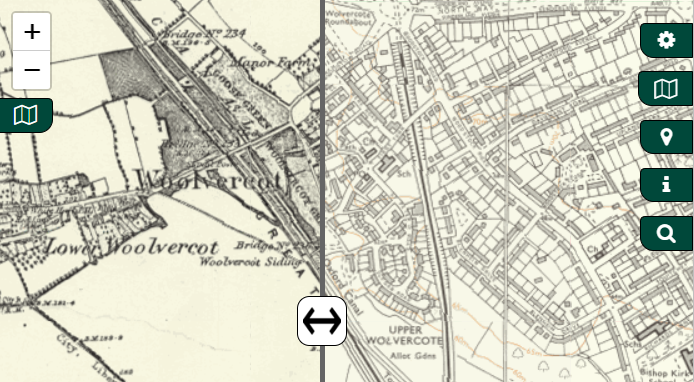
Screen layout - compare
Click / tap the Compare button in the Map layers panel to open the screen in ‘compare’ view, where two map layers move synchronously and are displayed side by side in two fixed windows

Select your first map layer for the right window, or omit selecting an historic map layer if you just want to compare against the modern base map
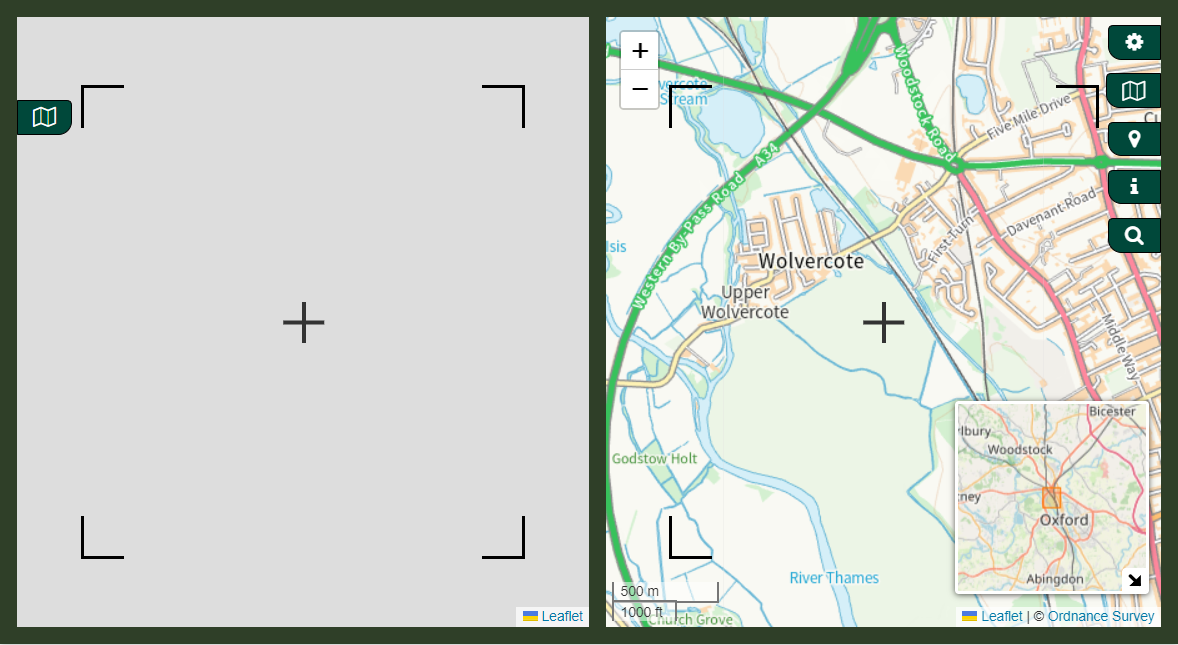
Having selected the ‘compare’ screen view, an extra Map button is now visible art the left side of the left window
Click / tap the left Map button to open the extra Map layers panel
From the left Map layers panel select the map layer you wish to view in the left window
You can now view the two map layers side by side, which will move synchronously as you click / tap and drag to move around the map, or zoom in and out
